


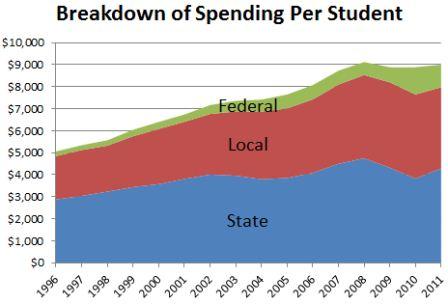
History of Spending Per Student in Georgia
|
Georgia Department of Education - Local, State, and Federal Revenue Report |
 |
|
Source: http://app3.doe.k12.ga.us/ows-bin/owa/fin_pack_revenue.display_proc |
| Year | FTE | Local |
Local/ |
Local% | State |
State/ |
State% | Federal |
Federal/ |
Fed% | Total |
Total/ |
| 1996 | 1,275,260 | $ 2,509,538,840 | $ 1,968 | 39% | $ 3,670,616,395 | $ 2,878 | 57% | $ 276,289,548 | $ 217 | 4% | $ 6,456,444,782 | $ 5,063 |
| 1997 | 1,308,058 | $ 2,728,231,355 | $ 2,086 | 39% | $ 3,979,233,918 | $ 3,042 | 57% | $ 281,590,579 | $ 215 | 4% | $ 6,989,055,852 | $ 5,343 |
| 1998 | 1,332,367 | $ 2,775,401,320 | $ 2,083 | 37% | $ 4,313,762,545 | $ 3,238 | 58% | $ 334,323,995 | $ 251 | 5% | $ 7,423,487,860 | $ 5,572 |
| 1999 | 1,357,391 | $ 3,135,012,871 | $ 2,310 | 38% | $ 4,670,765,289 | $ 3,441 | 57% | $ 399,548,195 | $ 294 | 5% | $ 8,205,326,355 | $ 6,045 |
| 2000 | 1,376,282 | $ 3,449,706,225 | $ 2,507 | 39% | $ 4,922,286,996 | $ 3,577 | 56% | $ 436,846,841 | $ 317 | 5% | $ 8,808,840,062 | $ 6,400 |
| 2001 | 1,426,679 | $ 3,697,905,915 | $ 2,592 | 38% | $ 5,439,669,382 | $ 3,813 | 57% | $ 474,907,514 | $ 333 | 5% | $ 9,612,482,811 | $ 6,738 |
| 2002 | 1,447,332 | $ 3,982,493,537 | $ 2,752 | 38% | $ 5,803,719,925 | $ 4,010 | 56% | $ 584,054,336 | $ 404 | 6% | $ 10,370,267,798 | $ 7,165 |
| 2003 | 1,471,333 | $ 4,295,165,553 | $ 2,919 | 40% | $ 5,825,401,669 | $ 3,959 | 54% | $ 708,957,538 | $ 482 | 7% | $ 10,829,524,760 | $ 7,360 |
| 2004 | 1,498,580 | $ 4,593,260,220 | $ 3,065 | 41% | $ 5,695,312,766 | $ 3,800 | 51% | $ 821,903,050 | $ 548 | 7% | $ 11,110,476,036 | $ 7,414 |
| 2005 | 1,528,133 | $ 4,834,565,349 | $ 3,164 | 41% | $ 5,890,066,550 | $ 3,854 | 50% | $ 961,761,037 | $ 629 | 8% | $ 11,686,392,936 | $ 7,648 |
| 2006 | 1,566,284 | $ 5,225,563,917 | $ 3,336 | 41% | $ 6,400,512,865 | $ 4,086 | 51% | $ 1,021,485,591 | $ 652 | 8% | $ 12,647,562,373 | $ 8,075 |
| 2007 | 1,600,653 | $ 5,767,032,931 | $ 3,603 | 41% | $ 7,200,951,318 | $ 4,499 | 52% | $ 1,003,997,700 | $ 627 | 7% | $ 13,971,981,948 | $ 8,729 |
| 2008 | 1,627,660 | $ 6,157,972,027 | $ 3,783 | 41% | $ 7,729,847,682 | $ 4,749 | 52% | $ 957,774,751 | $ 588 | 6% | $ 14,845,594,461 | $ 9,121 |
| 2009 | 1,630,541 | $ 6,326,056,922 | $ 3,880 | 44% | $ 7,044,061,283 | $ 4,320 | 49% | $ 1,117,640,068 | $ 685 | 8% | $ 14,487,758,273 | $ 8,885 |
| 2010 | 1,635,993 | $ 6,246,499,844 | $ 3,818 | 43% | $ 6,268,562,785 | $ 3,832 | 43% | $ 2,025,128,533 | $ 1,238 | 14% | $ 14,540,191,162 | $ 8,888 |
| 2011 | 1,641,114 | $ 6,048,714,740 | $ 3,686 | 41% | $ 7,040,615,848 | $ 4,290 | 48% | $ 1,679,948,832 | $ 1,024 | 11% | $ 14,769,279,420 | $ 9,000 |